A coefficient that is worth 200 billion dollars!
The Meta monopoly called into question
By Dominique Jacquet
In a recent interview with CNBC, Lina Khan, former chair of the FTC (Federal Trade Commission, in charge, among other things, of monitoring competition practices) talks about the trial that is opening for Meta and criticizes the acquisitions made by the company, Instagram (2012, $1bn) and WhatsApp (2017, $19bn).
She explains that the Facebook of the time, which became Meta, simply panicked when it observed the very rapid development of the activity of these two companies.
When Facebook went public (in a chaotic way…) in May 2012, we all discovered with interest the economic and financial metrics of this social network.
The stock market valuation will be based, as traditionally suggested by the discounted Free Cash Flow method, on profitable development prospects combined with investors’ expectations in the form of the discount rate for fund flows known as the WACC. This rate reflects the average return required by investors, shareholders and financial creditors, in proportion to their respective contributions to the financing of the activity.
Calculating Facebook’s WACC is a simplified exercise by the fact that the financial resources come from shareholders alone.
To estimate the return expected by the owners of the company, we use the model called CAPM which adds to the risk-free rate (the price of time) a risk premium calculated from the average risk premium of the equity market (about 6% for the US market) multiplied by a coefficient that reflects the relative risk of the firm in relation to the market.
It is this coefficient that is worth 200 billion…
The systematic risk coefficient, known as ß, reflects the sensitivity of the firm’s value to changing macroeconomic conditions. The company is not subject to this risk alone, but all the other risks that disrupt its activity disappear as if by magic by the insertion of the firm into a portfolio of securities (“modern” finance is called Portfolio Theory).
Measuring this coefficient involves an econometric calculation that correlates variations in the return of the security with variations in the return of the general index of the market on which the company is listed.
To estimate a correlation, one must decide the length of the observation period and the frequency of observations.
The following graph shows Meta’s “rolling” ß over 12- and 36-month periods with monthly observations.
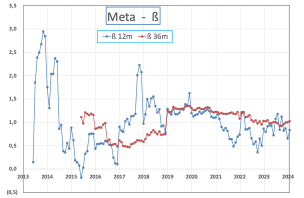
Several observations:
- The ß “12 months” is very volatile, which is why ß calculated over longer periods of time is preferred
- Beyond an observation period of 36 months, the economic validity of ß is greatly reduced in rapidly changing sectors. I therefore generally use a ß of 36 months for financial calculations.
The ß calculated in this way is very useful for the asset manager who has to select high ß assets when a stock market rise is expected and low ß assets when a stock market fall is expected.
For company executives and investors alike, the ß reveals the firm’s ability to navigate a volatile economic environment. A low ß indicates a high resilience to macroeconomic fluctuations. This is the case for companies in a monopoly situation, whether the latter comes from technological dominance or from a relative size allowing the firm to impose its conditions on the various stakeholders, customers, suppliers and, even, employees, thus being weakly sensitive to macroeconomic fluctuations.
In 2012, Facebook was in a monopoly situation and, after a few statistical fluctuations following the IPO, the rapid evolution of its ß would show its consistency with this state of affairs: the ß would converge towards 0.5. It should be remembered that ATT, which had a monopoly before the break-up of the group in the early ’80s, benefited from this same ß.
However, the coefficient is introduced in the calculation of the cost of capital.
Let’s take the year 2017. The interest rate on T-Bonds is equal to 3%, which leads to a shareholder return requirement equal to 3% + 0.5 * 6%, i.e. 6%.
If we calculate Facebook’s FCF from 2017 financial metrics, we get an amount equal to $11.6bn. By taking realistic growth assumptions (doubling of revenues in 7 years) and discounting FCF at a rate of 6%, we obtain an enterprise value of $480bn and a fundamental value of the stock of $170, quite close to the average price for the year which was about $160. The discount rate was justified by the monopoly situation enjoyed by Facebook, following the acquisition of Instagram and WhatsApp, in particular.
Let’s imagine that Facebook had let competition grow by allowing Instagram and WhatsApp to continue to grow independently. Then, Facebook’s ß would have lost its monopolistic character and would have increased to reach, perhaps, unity. Now, an ß equal to 1 gives a discount rate, now, equal to 3% + 1 * 6% = 9%.
If we discount the same FCFs, but now at a rate of 9% instead of 6%, we get a new enterprise value close to $265 billion, a decrease of more than $200 billion.
So, it was critical for Facebook to maintain its monopoly status for as long as possible. Buying Instagram and WhatsApp for a total of 20 billion was ultimately paying only 10% of the potential value destruction!
As Lina Kahn indicated in the interview, it was a kind of “buy or bury” for the company.
Today, many competitors are multiplying initiatives in the social network sector and it is hard to imagine Meta buying Tik-Tok to reduce its ß to 0.5…